
Let’s see your evidence!
If you keep up on the gaming press, you’ve probably read about various industry figures arguing about next gen costs and quality. There’s Midway marketing guy Steve Allison arguing that 93% of new IP games fail (followed by this retort), Blast Entertainment CEO Sean Brennan decrying next gen console development costs, and industry analysts divided over the amazing success of the Nintendo Wii in spite of its comparatively underpowered graphics hardware.
Developers and marketers alike are struggling with the idea that the costs associated with next generation game development may make it unprofitable, which I’ve ranted about before. Next gen is a high-risk environment right now, and as previously discussed, risk means a dearth of innovative or niche games.
Game companies have a few problems. First and foremost, developing games for Xbox360 and PS3 is way expensive. Secondly, developing for the Wii is easier and cheaper, but it means you have to compete with Nintendo’s first party games, which are always powerful market forces. Finally, since development of any next gen game will take several years, companies are having to place a bet on which consoles are the most likely to be the most profitable in 2009. Of course, it’s possible to do games in less time than that, but usually the quality suffers dramatically. So the real question here is how much can quality suffer without impacting sales? Some people believe that there’s no correlation between quality and sales, and thus think that the way to make money is to make things that are easily marketable (read: licenses). Game developers themselves usually argue that sales above a certain level require a game to be sufficient quality. I decided to see which of these perspectives was correct for the Playstation 2 era.
Quality vs Sales
It is time for some graphs. What I did is take sales data from December 2006 for every PS2 game released in North America and correlate it with the score for the same game from Metacritic.com. There are about 500 games that were thrown out because they were not released in North America or because they had no Metacritic ranking. I used the remaining 1281 games in the data set to look for some correlation between game quality (as defined by Metacritic’s score) and sales.
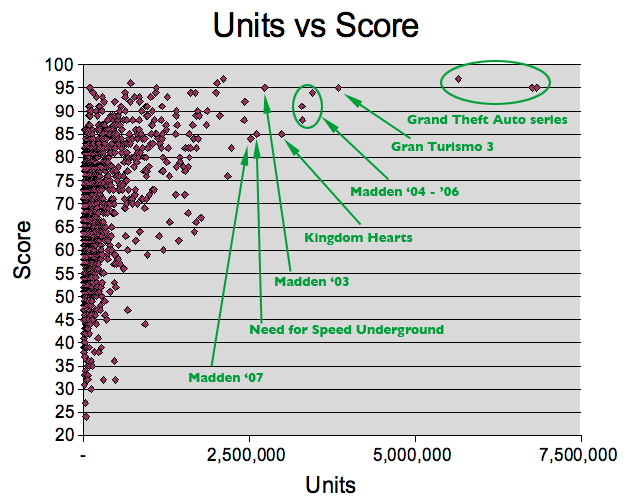
This graph shows the data as a whole, with number of units sold on the horizontal axis and Metacritic rating on the vertical axis. Most of the data is scrunched way over to the left side of the graph because most games sold an order of magnitude fewer units than games like Grand Theft Auto 3. You can see a curve in the data, though: as more units are sold, fewer and fewer games rank below 80%. This initial view is encouraging; it seems to suggest that there may be a correlation between sales and quality after all. To get more information we need to cut out the outliers. Capping our graph at two million units shows the curve a little more clearly.
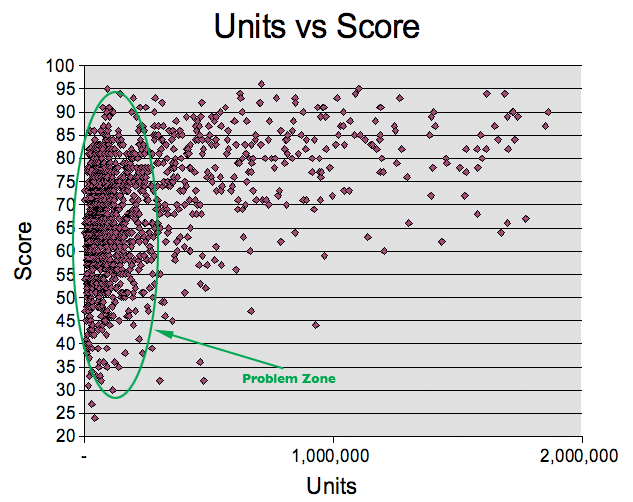
There is clearly a trend in this data: no game that sold over 1 million units scored less than 60%. Though the distribution between 60% and 90% is fairly random, the lack of titles below the 60% range after the 1 million mark means that really bad games have an upper bound of sales regardless of the marketing or license applied to the title. This graph has some problems, however. Most of the data points are still clumped together on the left side of the graph, an area we can call the Problem Zone. It is a problem because the number of points is too dense to tell what is really going on in there. We need to zoom in further.
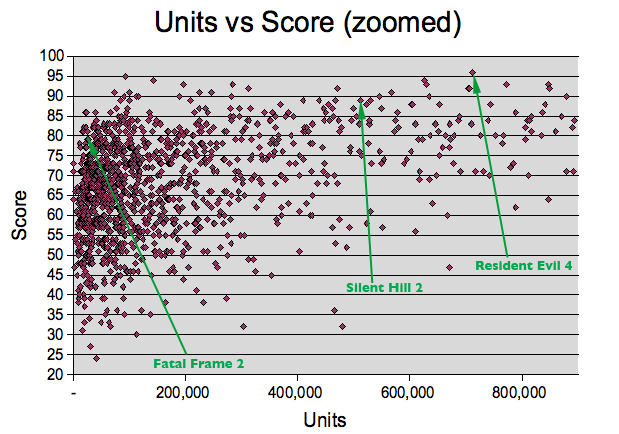
If we limit the view to 800,000 units, the Problem Zone gets a little clearer. We can still see the trend towards higher scores as the units increase, but the distribution also becomes more random, which means that some games with rankings in the 50% range are still able to sell around 500,000 units. This may be where marketing is flexing its muscles, though we can see from the overall shape of the graph that marketing alone can only take a game so far. Even at this resolution the Problem Zone is pretty noisy, which means that there are a lot of games that did not sell very well on PS2.
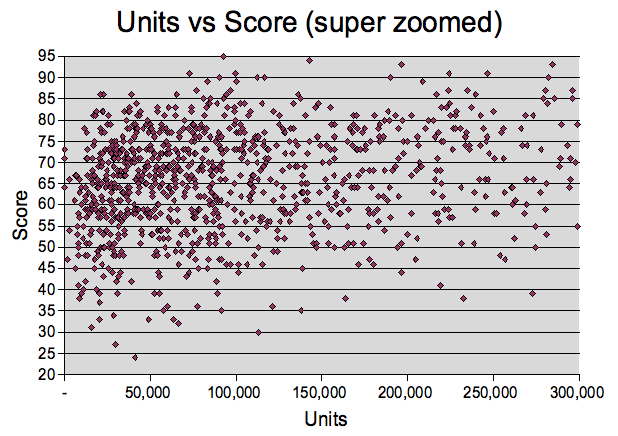
This is a close-up of the Problem Zone. We can see that at this range (between 0 and 300,000 units) the distribution of scores to units is almost random. All of the games in this range sold fairly poorly (though some may still have been profitable depending on how much was spent on development), and they represent the entire spectrum of scores. The randomness of this distribution means that within 300,000 units, the marketing people are absolutely right: there is no correlation between sales and quality. We see plenty of 90% and higher games that sold just as well (or as poorly) as games that scored below 50%. What this graph does not tell us is why bad games sold–it only shows that Metacritic rating was not a major factor.
The other interesting thing about this last graph is the number of data points. The graph is much, much denser than the ones before it, which means that most PS2 games fall within this range. In fact, even though we have zoomed way in to look at the Problem Zone, we can still see a cluster below the 100,000 mark. This means there are a whole lot of games that never even moved 100,000 units, making them almost certainly financial failures.
Analysis
So what does all of this information mean? Here are my conclusions:
- Any game can fail, regardless of its quality. There are a great many games at the low end of the graph, and some of them received extremely high scores. Making a high quality game is therefore not an automatic guarantee of financial success.
- However, bad games have a much more difficult time succeeding. While making a high-quality game does not assure that a lot of units will sell, making a low-quality game does guarantee that the maximum number of units sold will be limited.
- There are no bad games that sold over a million units.
- Of the 19 games that sold over two million units, only one received a score of less than 80%.
- If we assume that game scores are assigned independently of marketing budgets, we can see that there is an upper bound for marketing’s influence on sales; if there were no bound, we could expect to see many more bad games selling past the 500,000 units mark.
- However, I think we can also assume that even good games cannot succeed without excellent marketing. If sales were driven by quality alone, there would not be any high-scoring games in the Problem Zone portion of the graph.
- A huge number of PS2 games games (about 45%) failed to ship more than 100,000 units.
This means that there is a correlation between game quality and sales which can be stated thusly: bad games do not sell. This does not mean that good games always sell, just that bad games cannot be saved by marketing. The data also suggests that the games that sell the most have to not only be really good, they also have to be marketed heavily. The conclusion is not that marketing is irrelevant, only that its powers are limited without the help of high quality game play. Developers who want to sell units should be striving to make good games if only because quality will allow their marketing department to actually be effective.
Other Information
Since I went to all the trouble of compiling this data, I figured I can get a few more graphs out of it before this article is done.

Here is a comparison of unit sales. As stated in the previous section, a lot of games failed to ship over 100,000 units, and about 80% of titles released for PS2 shipped less than 300,000 units. Depending on the cost of development and the sticker price of the game in stores, these games likely generated very little profit, if any. By next generation budget standards, these games are all abysmal failures.
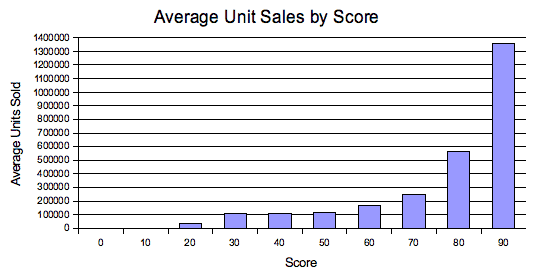
This graph compares the average number of units sold against score ranges. It suggests the same conclusion that we came to above, but it is a little less accurate because it deals with averages (especially in the 90th percentile, where the GTA games really bias the result). Still, the message to developers should be clear: good games have a much better chance of selling than bad games.
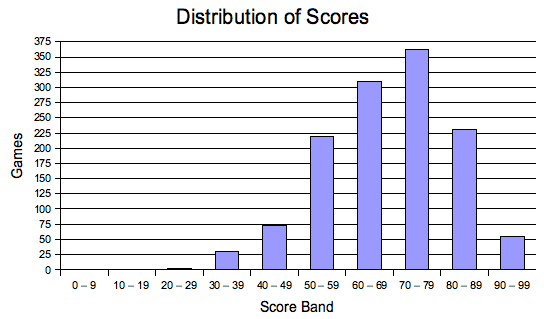
This last one is the distribution of rankings across all 1281 games. This is probably more of a commentary on game journalism than anything else. It shows that most games score in the 70% range in aggregate, and that there is almost a bell curve with 75% at the peak. Ratings lower than 60% are generally meaningless, as all the reviewer needs to communicate to the reader is that the game is not worth buying.
What I think is interesting about this graph is the drop off between the 70% percent range and the 80% percent range. Many game developers believe that game reviewers subconsciously abide by a rule called the “80% Divide,” which stipulates that a game must impress the reviewer in some way to achieve a rating of 80% or higher. If the game has no major flaws and yet fails to impress the reviewer because it is not “new” enough, it will often receive a score of 70%. Games that are broken in some way but have some impressive aspect or feature can still make it into the 80th percentile (like Indigo Prophecy, for example). This graph seems to suggest that this “80% Divide” represents a real bias amongst the game journalism community.
Conclusion
So there you have it. I hope that this article adds to the interesting debate between game industry pundits about how games should be created, marketed, and sold for the next generation. I do not claim a side in this argument, but this research suggests that neither marketing nor the developers are wholly responsible for driving sales. That said, it also suggests that it is in the best interests of game developers to make high quality games.
An impressive data compilation; may I ask from where you got the PS2 sales data?
Interesting. Now let’s just hope that developers come to the same conclusion, so I don’t have to play through another Trigger Man.
Awesome article. Props for compiling all of this.
Pretty amazing. All those hours in boring stats classes actually helped me understand this.
if your ps2 data goes back to launch it would explain away some of the games that sold sub-500k units with a high review score as the installed base for the console would be at the low end. They may have reviewed well and had a high attach rate to the ps2 hardware that was shipped/installed at that point in the life-cycle.
Interesting exercise and firm backing for me to try to squeeze more marketing budget out of my board!
You assume a “good game” to be synonomous with “high metacritic scores”. The fact of the matter is, these game review sites rely on payola and “reviewvertisements” and are way to influential on sales.
Look at Assassins Creed on IGN, notice the difference in reader rating and their rating (7.5 and 9.1). Someone needs to demolish the current game review industry with something new.
http://curmudgeongamer.com/article.php?story=20031102194601504&m
> Marc
Well, I do note in the article that I’m interested in “quality” as it is defined by score. The whole point of this investigation was to see if score has any meaningful correlation with sales. Whether or not score has any meaningful correlation with actual quality is another, open question.
I will say that I think that these graphs are useful for a couple of reasons. First, I think that generally, there is a correlation between review scores and actual quality. I think that the correlation is pretty weak sometimes (why is 7 “average” and not 5? why do games like Phoenix Wright get punished for being 2D? how much “better” is a 98% game than a 97% one?), but generally I think that game reviews are useful. I think their utility is increased when considered in aggregate (thereby removing bias from individual reviews, if not from the industry as a whole), which is why I used Metacritic for this study.
Second, even if reviewers are bias and unfair sometimes, I don’t believe there are many other metrics by which we can objectively compare games for quality. Sales numbers, as I hope this article shows, often have little to do with quality, and reader ratings are not reliable either. I refer you to this excellent article:
http://curmudgeongamer.com/article.php?story=20031102194601504&mode=print
Finally, whether or not reviews say anything about a game’s quality, game publishers look to them to explain why certain games succeed or fail. So even if the metric is totally bogus (which I don’t think it is), understanding the correlation between what reviewers say and how much games sell is useful because it gives us some insight into how game concepts get green-lit (or, in too many cases, prematurely canned).
You know, a moving average graph would be great here. Order the games by units sold, then for each game, take the average rating of the 25 games above it and the 25 games below, then show these same scatter graphs, but with the averages instead of the actual ratings for each game. I think that would really lend itself to the point you’re making. (Chop off the first and last 25 games, by the way.)
I would love to see a measure of “fun”
Good graphics, awesome playability, and high sound quality are not always related (as your graphs show) to a “good game”
However, they can, like set design in the movies, detract from fun.
Many games just aren’t fun. They make you do repetitive tasks, or fight things that are hard, not from a game perspective, but from a tedium perspective (he’s got 600 HP and I do 1 damage per round and he heals twice?! That’s like an hour of doing nothing but ducking and hitting)
I’d love to see a Player’s rating of fun compared to your graphs. I think the correlation would be stronger.
> MithrynMarious
Ah, if only fun were so easy to define! In that case we would hardly have any bad games at all, I think.
It’s true that “highly rated” doesn’t always mean “fun,” especially because “fun” is so subjective. I’ve tried to fight this by using aggregate ratings, but of course it’s never going to be representative of all people. However, I am skeptical that users are any better at defining fun; see the comment a few posts up for a page comparing review scores and user scores in aggregate and I think you’ll see what I mean.
http://www.heresy.com
Awesome analysis – If there’s one take-away, the whole 80% rule (might) really helps reviewers take points into consideration and prevent another Kane and Lynch debacle.
Above, Marc Miles statement isn’t accurate – good games are defined by four methodologies – their sales, their critical reviews, their player buzz, and the post-game memory lane of “I remember when [insert Sid Meier or Wil Wright title here]….” Five methodlogies if you include the stupid “Yeah, but is it fun?” boolean flag.
The last two are not measurable statistically, but the first two you did capture the differences.
I’d also like to see the unit of sales over period of time… thus when did one game start selling faster (buzz indicator) vs. tapering off (good example – the day WoW went live, CoH was a ghost town).
Anyways… excellent job, thanks!
Nice, job getting the data. You should learn about regression. It will add to your ability to draw statistical conclusions from data.
This was/is a good article, Chris. Congrats on getting discovered by the Reddit crowd!
http://rhinocrisy.org/
I’d be interested in seeing an aggregate plot – that is, total sales per score bin. What fraction of total sales were due to 90% rated games? What fraction due to 50% stinkers? Etc.
You could bin the data and apply a Poisson distribution based on units sold.
ie: for 0-100k units sold, bin the data based on score (0-10, 10-20, 20-30, etc…) and fit a Poisson curve. Then repeat for 100k-200k units, etc…
Of course it won’t go out to infinity, but it looks like a Poisson distribution would adequately fit the data for under 1M units sold.
Can you post a csv file or some such? I’d love to play with it.
> Ryan
Nope, sorry. This research is based on NPD data that isn’t public information. People pay a lot of money for this data, and while I have some access to it via my employment, I can’t distribute it. That’s why there are no numbers on these graphs.
I wonder how many of the over 1 million games got higher than 90% in graphics?
http://www.massivemutant.com/?p=20
Good info.
http://www.vgpc.com
Great article, it makes we wish I had access to the full NPD numbers too.
Did you run any regression on the data in the super zoomed chart? It looks to me like there is some correlation but was wondering if you ran the regression to find out. I would be interested in seeing the p-value and r-squared if you did. Thanks
I did some research like this about two weeks ago on the review score vs the resale value. Same basic results, better games keep their value longer.
There is something else that strikes me as even more important than the review score from the graph. All the games that sold extremely well were all “western” games, except for Kingdoms Hearts, which is japanese. However, it uses Disney characters… and Mickey Mouse is pretty much as all-American as Coca-Cola. Woops… nevermind GT3. On the other hand, all survival horror games you pointed out are japanase. It seems that westerners (or at least north-americans) want to play western games, and the reverse is probably also true. This explains why the Xbox sold so well here and so poorly in Japan. Anyway, if you separate games by their origin, you’d might get a more consistent link between quality and sales. Genre is also probably important (lots of racing games, sports, shooters).
Nice to read article, I just want to comment on the graphs, especially the “problem zone”. I think that with sales ranging over such a huge width (7 orders of magnitude) it should be better to plot the graphs semi-logarithmically, with the x-axis as a log-scale and the y-axis “normal”. This would clear up the problems mentioned below the last “problem zone” graph.
Any chance of getting a spreadsheet with your raw data posted? I would love to do a regression analysis on this data. Graphs are a good way to see relationships at a high level, but like JJ Hendricks says above, the regression will tell you HOW correlated the two are. As in for every 1 metacritic point, your game will average X sales.
Would you consider doing more analysis? Maybe coloring the dots based on year produced, to at least give an idea if there’s a trend in ‘quality'(as defined by review scores) or in sales. Or giving the marks some sort of indication as to the clout of the developer? This sort of data, though IMHO it falls victim to the bane of statistics, improper information, can give a lot of insight.
Very nice info. It would be interesting to somehow work the publishers into that graph and see how the bigger publishers affect sales. Some of those high scoring games that didn’t sell well probably didn’t have very well known publishers.
Something’s not clear in your explanations. Are the sales data for “dec 06” or for “up to dec 06”. How did you account for different release dates? Without knowing any of this, it’s hard to make sense of what I see.
Also, ever considered using a log scale on the x-axis?
> Joe_W
Yeah, a logarithmic x-axis would make the graph easier to read, especially in the problem zone. I didn’t use it when I initially wrote this because it made the zoomed out graph much less clear. The part of the problem zone that I was interested in was where it starts to trail off, since that’s where marketing power must end. So for that purpose, this was sufficient, but it would be nice to have a better look at that problem zone. And yeah, I should do some real regression.
> Factoid
Sorry, I really can’t release the sales numbers. The metacritic scores can be pretty easily scraped though.
> Viktor
I’d like to, if there’s enough interest. This article has been up for a couple of years, and while every once and a while it gets some traffic, it’s a little esoteric for this site. But if people want it I’d like to spend more time on this topic.
> Nick R
I suspect it has more to do with the amount of money that the publisher threw into the project and the license that the project employed than the noteworthiness of the publisher. Still, I could probably prove that with the graphs that you are suggesting.
> Tizzy
It means “All sales up to Dec 06.” I can’t remember if this includes December from that year or not. I didn’t have information about release dates, so they are not accounted for at all. However, the general wisdom within the game industry is that most copies of any given game will sell in the very first weeks and months after it is released, so I didn’t worry about it too much.
What I found interesting was that 9 of the 11 top selling games were all part of a series, and not a one time release title. Standout sequels like GTA succeed on there relative ingenuity and innovative gameplay concepts. Gran Turismo is a niche game for racing fans and rarely reaches the masses of gamers, but it is one of the most technically sound, and the real-life physics is amazing. Madden is, well defines the phrase “easy to learn, impossible to master”. The game is as simple or complex as you want it to be, and has almost infinite replay-ability. Point is, none of the above games have cutting edge graphics that cost the most during development, and are is on the usual suspect list of any bug. They succeed with creativity and ATTENTION TO DETAIL. They succeed with good writing, dedication to fun and GAME creation by people other than programmers, marketers and suit-and-tie corporate ass-eaters. 9 out of the top 11 for 3 series titles, interesting…….
The outliers in each rating zone are what I find interesting. What’s that game that scored around 47 on Metacritic, but wound up selling almost 700k units? Or that little group of three games scored in the mid-60s, but which each sold around 1.7 million units?
st.thomsen-jones.co.uk
Good to see an article with a good amount of effort going into it, not that I’m suggesting this isn’t normal for this site, it’s my first visit. What would be really nice is if we had some kind of handle of the sales price of these games and see what influence that had on things. Could use original RRP of course, but in general the ‘big name’ games will have gotten the bigger discounts from the retailers as they know they will shift units.
i love that game
You should all read
HOLLYWOOD ECONOMICS by Arthur De Vany… he pretty much does what you have done but tailored to Hollywood.